MUSE Science Data
The Multi Unit Spectroscopic Explorer (MUSE) is a second generation instrument installed on the Nasmyth focus of UT4 (Yepun) at the Very Large Telescope (VLT) of the European Southern Observatory (ESO).
It is a panoramic integral-field spectrograph operating in the visible wavelength range. It combines a wide field of view with a fine spatial sampling and a large simultaneous spectral range. It can take advantage of improved spatial resolution provided by the adaptive optics facility (AOF). MUSE started observing in 2014.
Here the MUSE team distributes data from some commissioning and guaranteed time observing programs. At the moment, the following datasets are available here:
- Orion Nebula (M42)
- Antennae Galaxy (NGC 4038/39)
- Tools for handling MUSE data
Orion Nebula (M42)
Release of cubes and maps of the Huygens region of the Orion Nebula (M 42) published by Weilbacher et al. 2015 (2015A&A...582A.114W or arXiv:1507.0006).
Full Cubes
The complete datacubes in FITS formats are linked here.
- standard MUSE wavelength sampling, LR|1.25
- direct download from NL/Groningen (75 GiB FITS file)
- improved wavelength sampling, HR|0.85:
- direct download from NL/Groningen (110 GiB FITS file)
Maps
All maps presented in the paper are reproduced here. We also provide FITS versions of all of them.
Color images
Maps related to color images in different narrow bands.
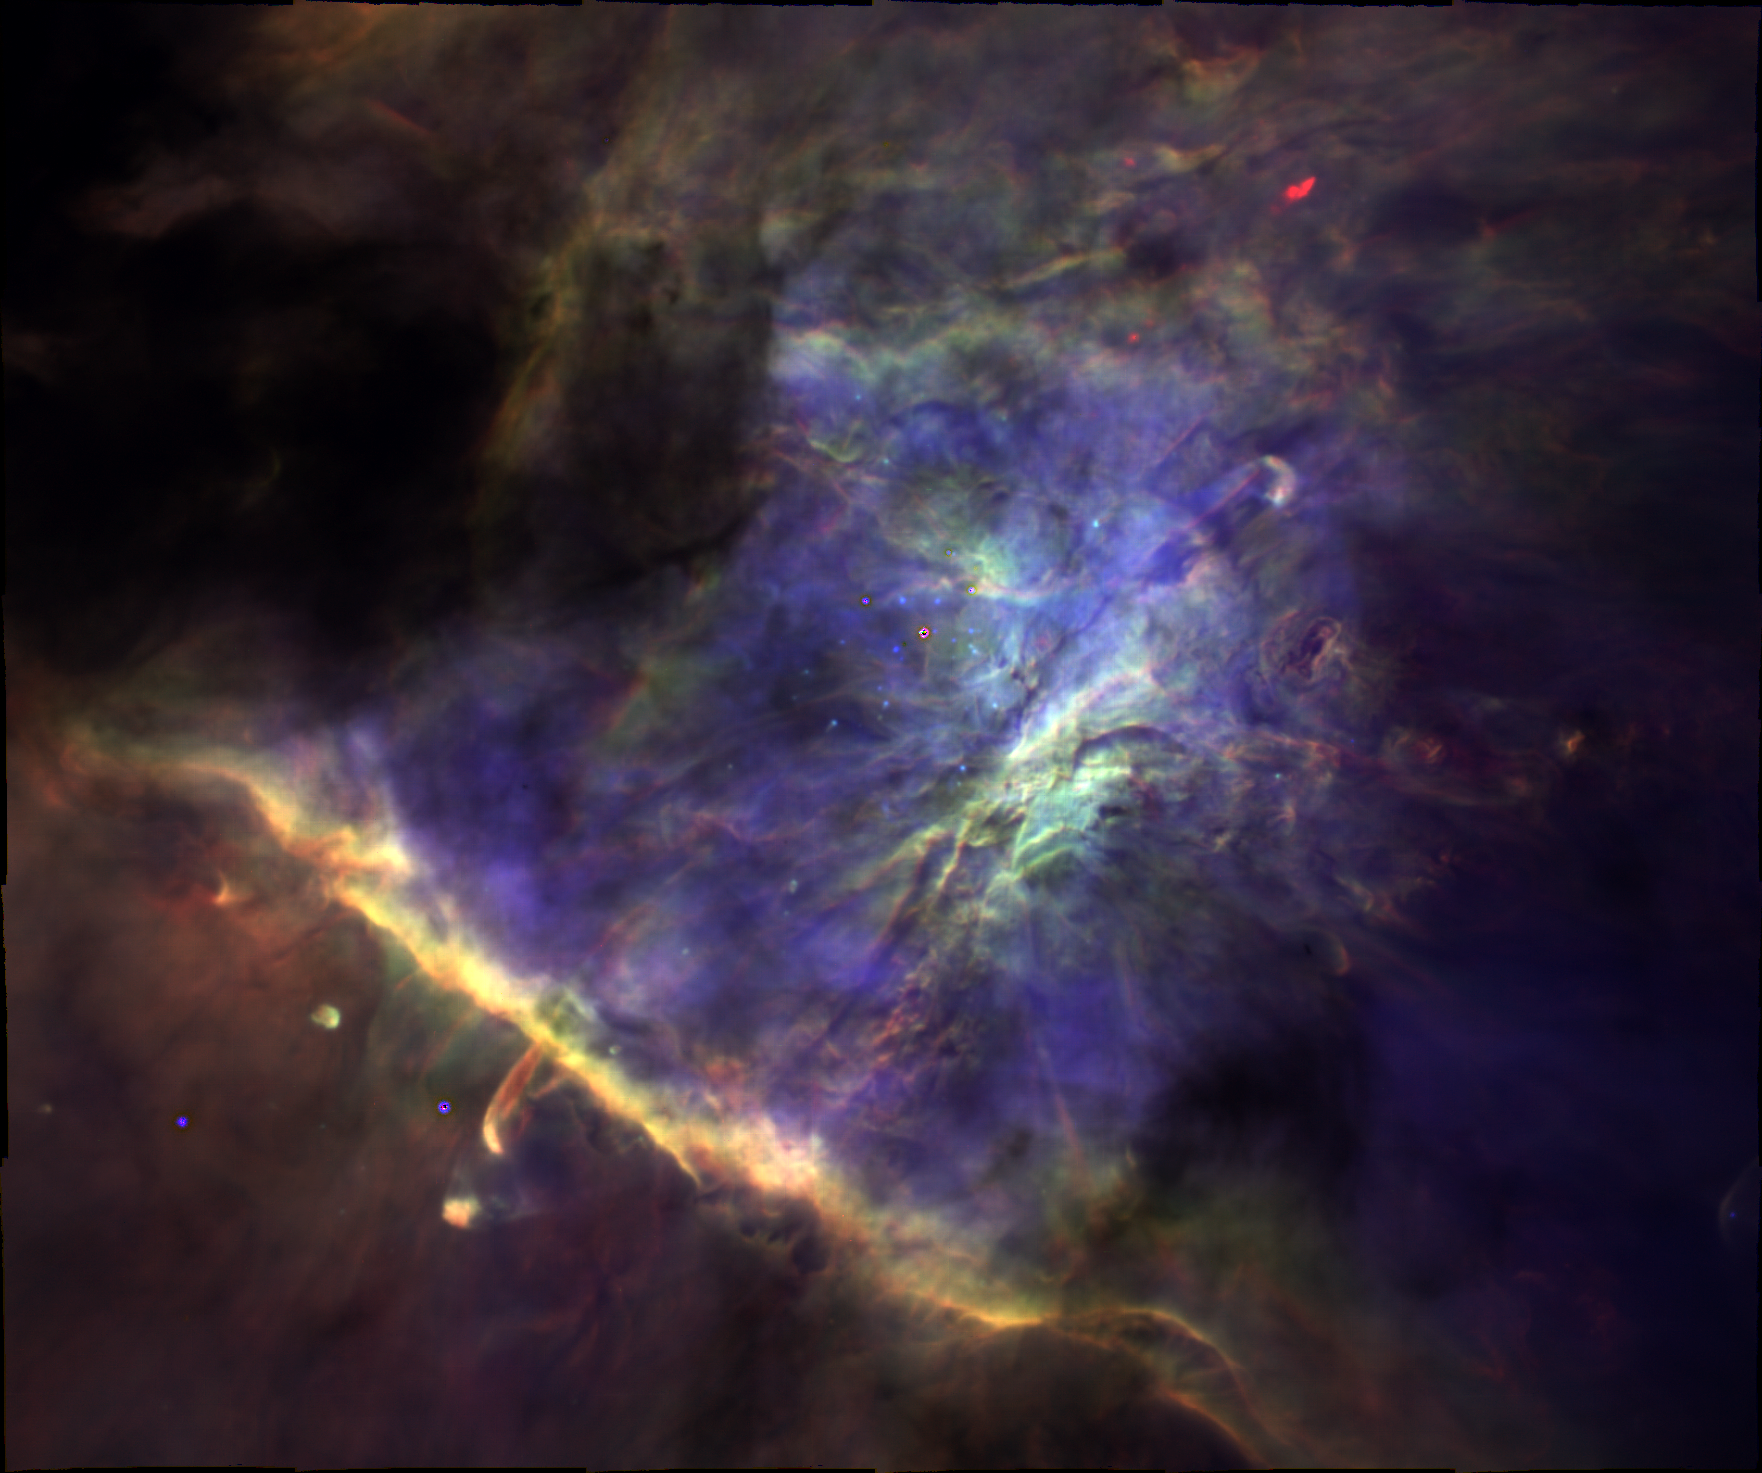 Color composite using fluxes of three emission lines, with blue: Hβ, green: [N II] 6584, and red: [S II] 6731. Link to FITS files:
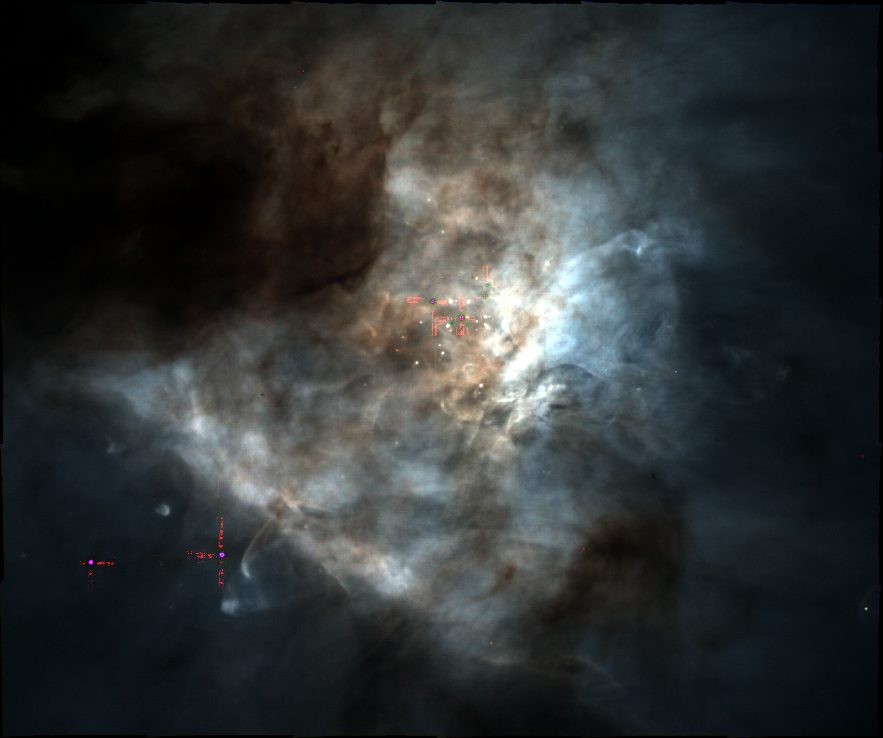 Color composite, using emission line fluxes of red: Paschen 9, green: Hα, blue: Hβ. Link to FITS files:
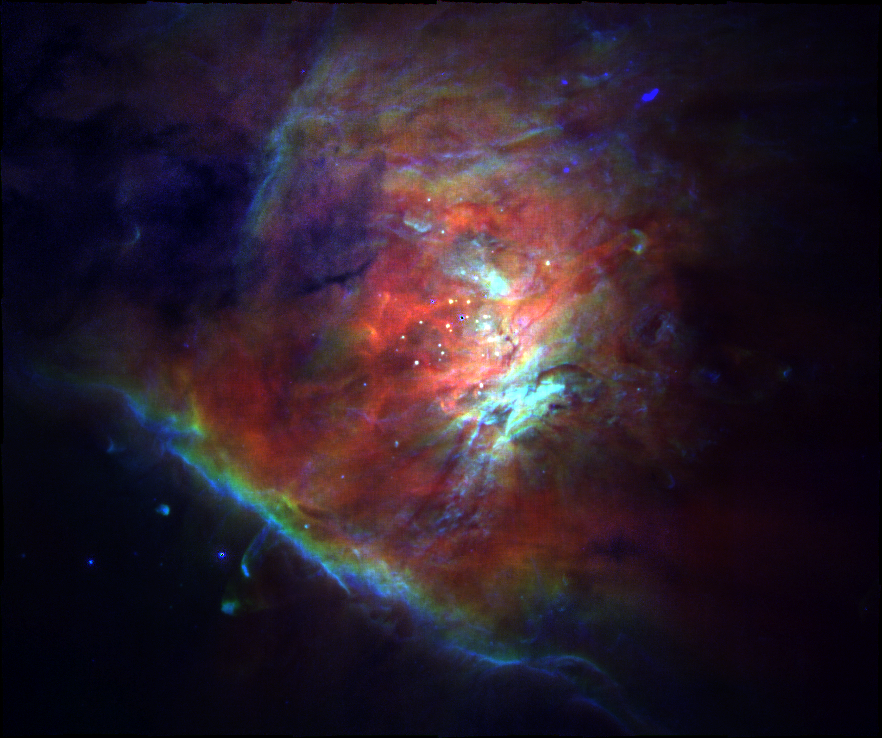 Color composite using the three ionization levels of oxygen detectable with the MUSE data: red: [O III] 5007, green: [O II] 7320, blue: [O I] 6300, all corrected for extinction using the Balmer decrement. Link to FITS files:
- dereddened [O III] 5007 flux map
- dereddened [O II] 7320 flux map
- dereddened [O I] 6300 flux map partially corrected for sky contribution and uncorrected for sky contribution
Extinction map
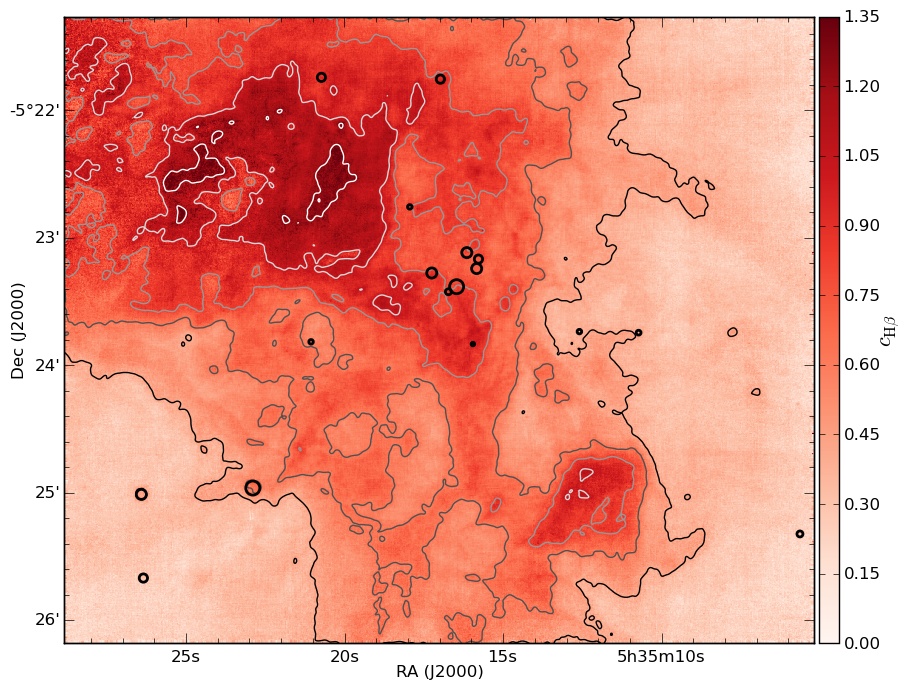 Extinction map of the central Orion Nebula, as derived from the Hα to Hβ flux ratio, displayed as c_Hβ. Bright stars are marked again with black circles, the smoothed contours are 0.4 ≤ c_Hβ ≤ 1.2 in steps of 0.2. Link to FITS file: cleaned image
Single emission lines
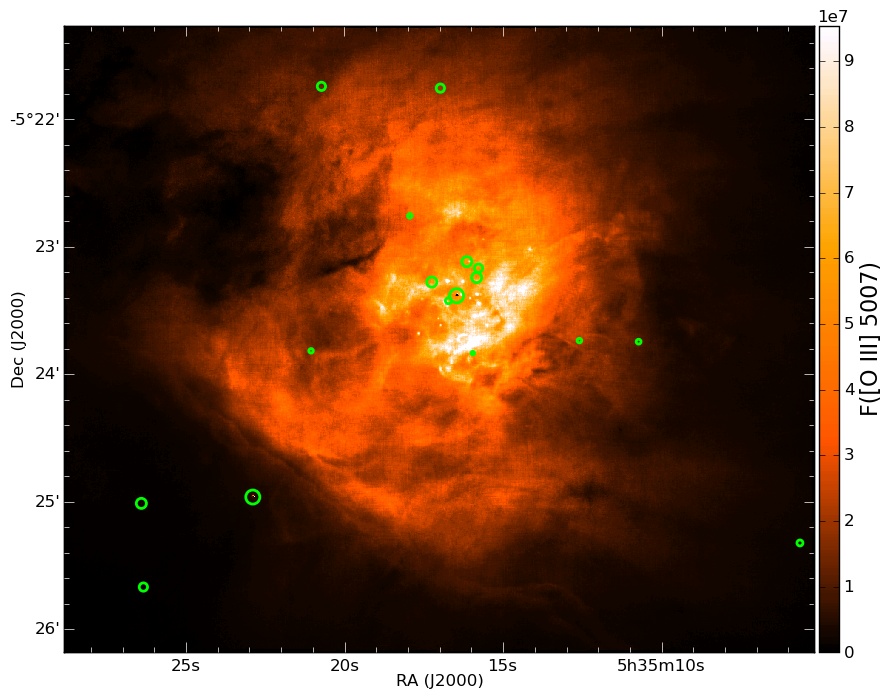 Reddening-corrected flux map of [O III] 5007. Link to FITS file: [O III] 5007 flux map
 Reddening-corrected flux map of [S III] 6312. Link to FITS file: [S III] 6312 flux map
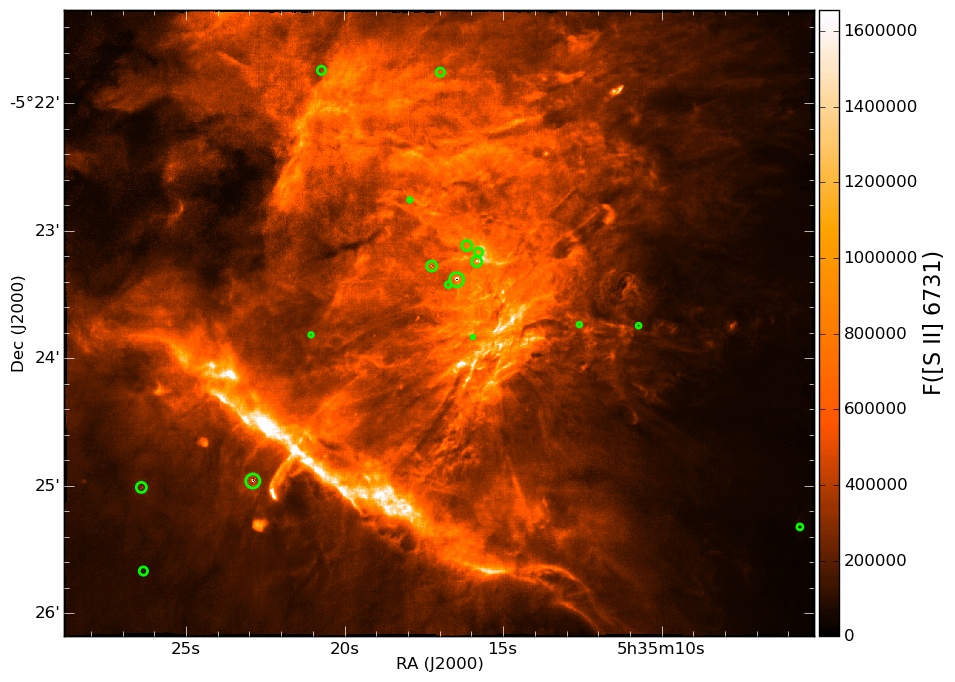 Reddening-corrected flux map of [S II] 6731. Link to FITS file: [S II] 6731 flux map
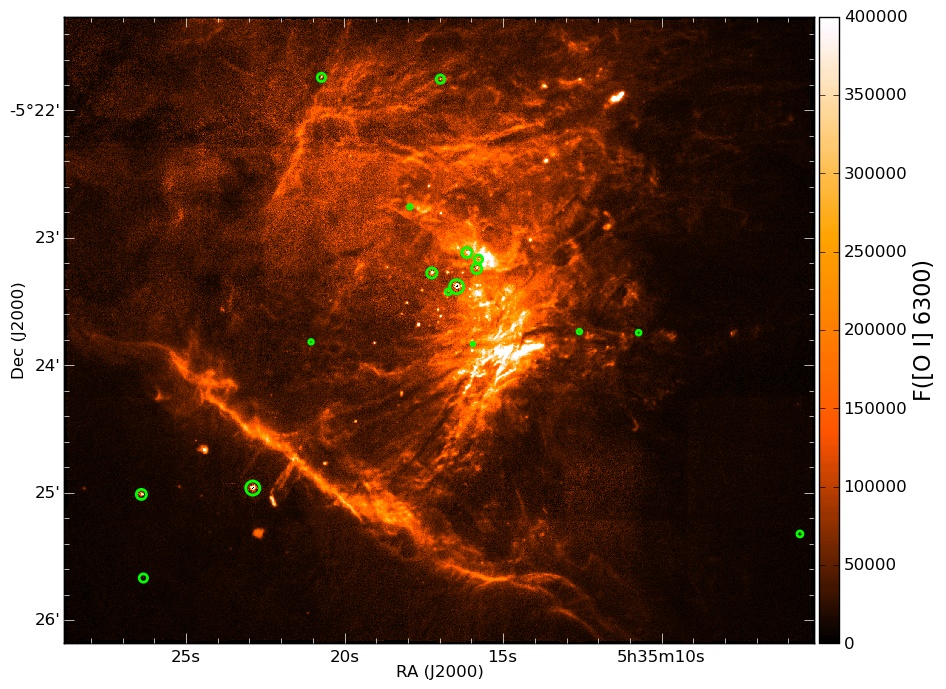 Reddening-corrected flux map of [O I] 6300, partially corrected for sky-line contribution. Link to FITS files: [O I] 6300 flux map (original), (partially corrected for sky contribution)
Extra map not displayed in the paper: Reddening-corrected flux map of [S III] 9069. Link to FITS file: [S III] 9069 flux map
Diagnostic ratios
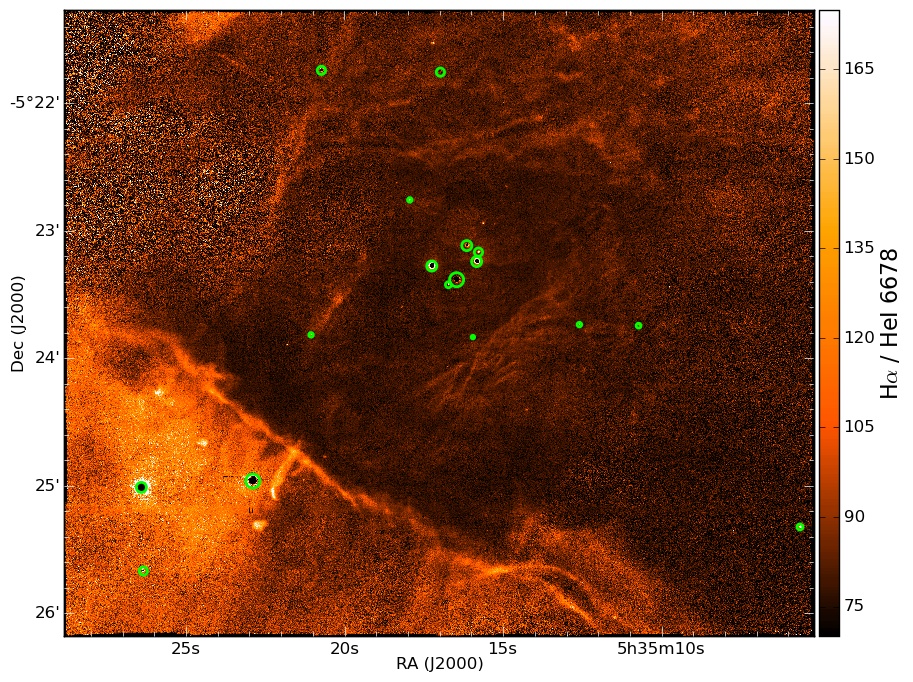 Reddening-corrected emission line ratio map of Hα/He I 6678. Link to FITS file: Map of Hα flux divided by He I 6678 flux (both dereddened)
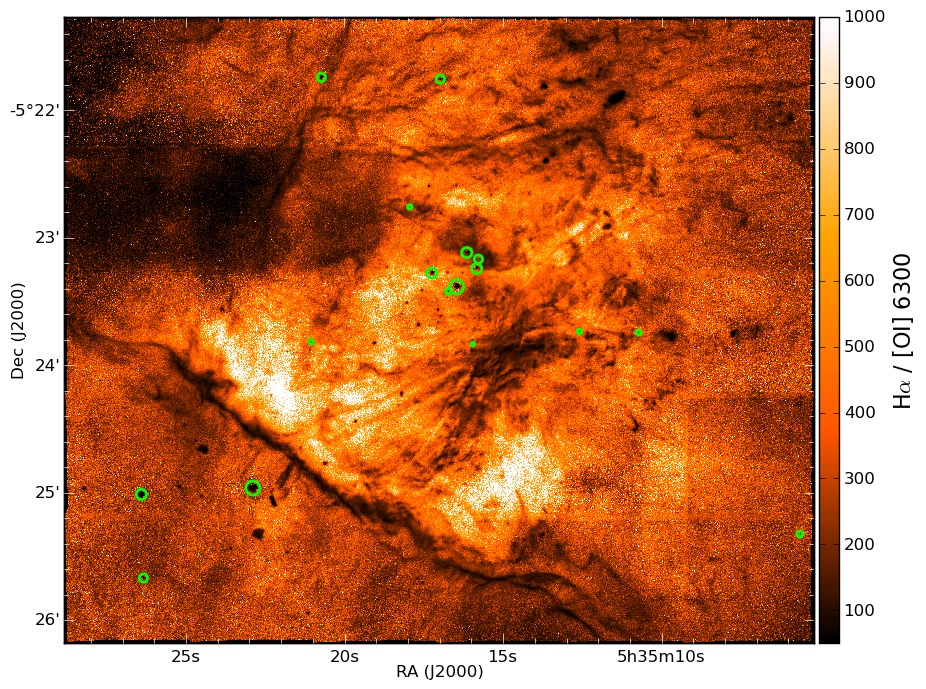 Reddening-corrected emission line ratio map of Hα/[O I] 6300, partially corrected for sky-line contribution to [O i] 6300. Link to FITS file: Map of Hα flux divided by [O I] 6300 flux (both dereddened, [O I] partially sky corrected)
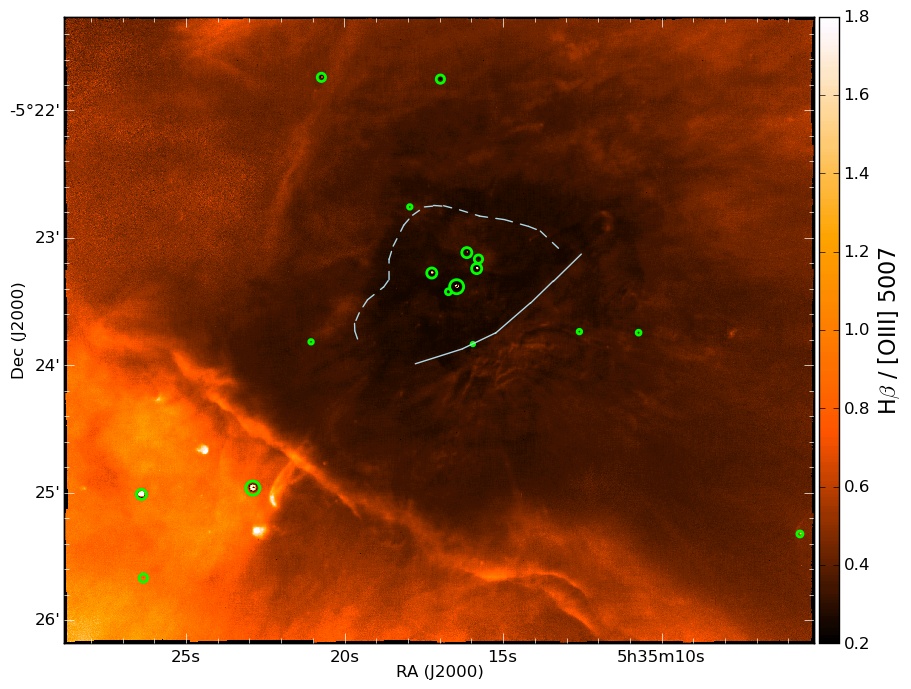 Reddening-corrected emission line ratio map of Hβ/[O III] 5007. The [O III] shell and the SE-NW ionization boundary discussed by O’Dell et al. (2009) are marked. Link to FITS file: Map of Hβ flux divided by [O III] 5007 flux (both dereddened)
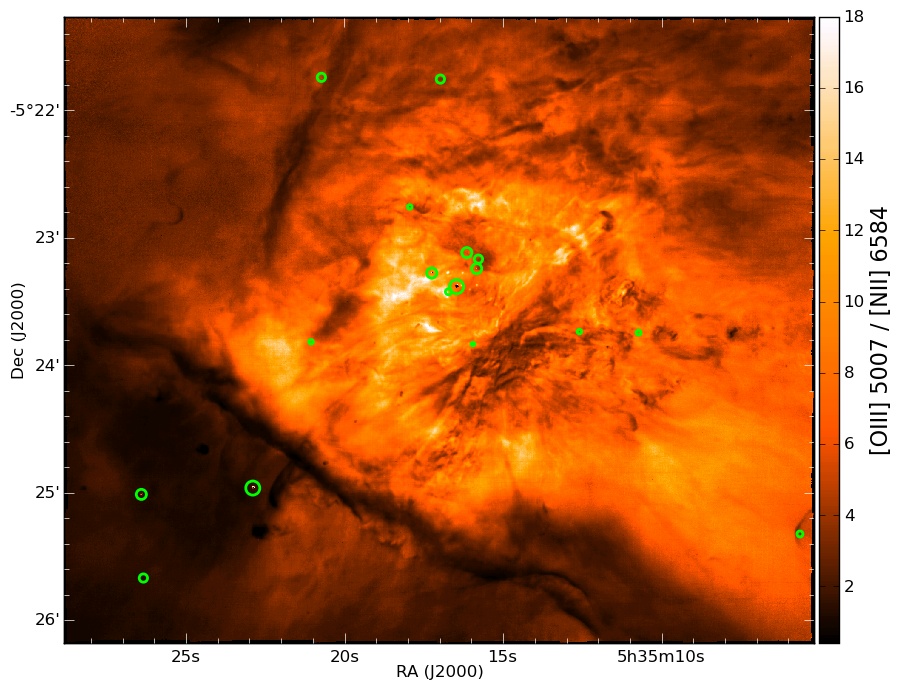 Reddening-corrected emission line ratio map of [O III] 5007/[N II] 6584. Link to FITS file: Map of [O III] 5007 flux divided by [N II] 6584 flux (both dereddened)
Physical properties
Electron temperature
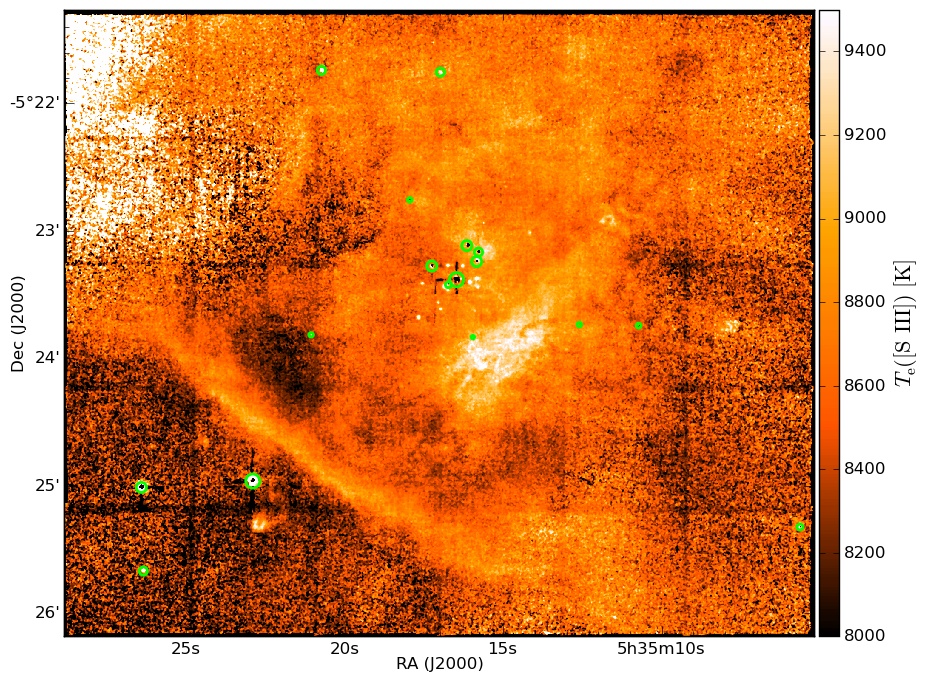
- Electron temperature (T_e) of M42 computed from [S III]* Link to FITS files: T_e map unsmoothed and smoothed (with 5x5 pixel median filter)
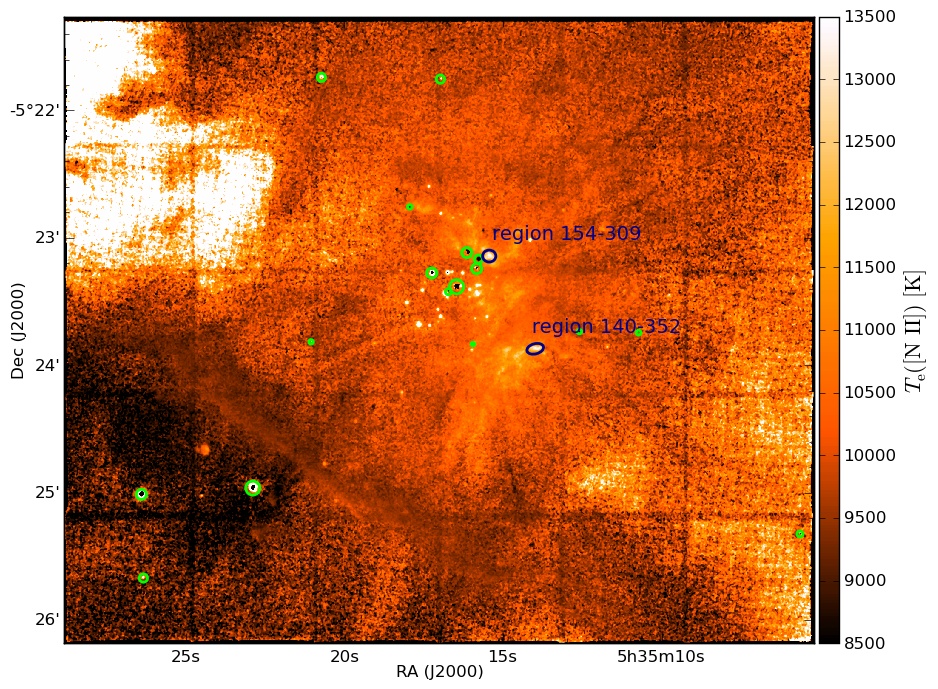 Electron temperature (T_e) computed from [N II] Link to FITS files: T_e map unsmoothed and smoothed (with 5x5 pixel median filter)
Electron density
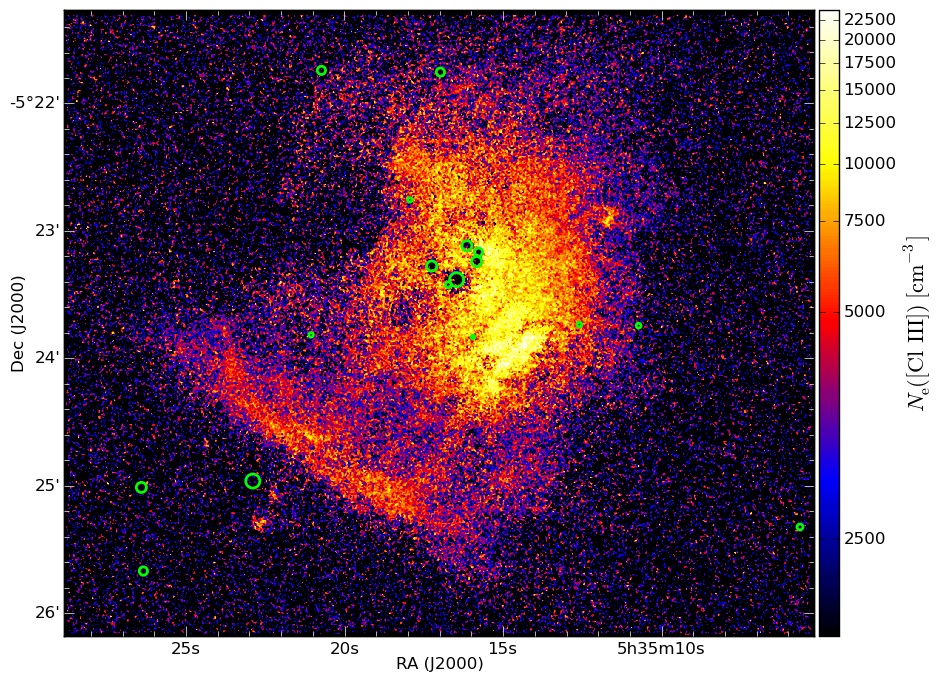 Electron density (n_e) of M42 computed from [Cl III] Link to FITS files: n_e map unsmoothed and smoothed (with 5x5 pixel median filter)
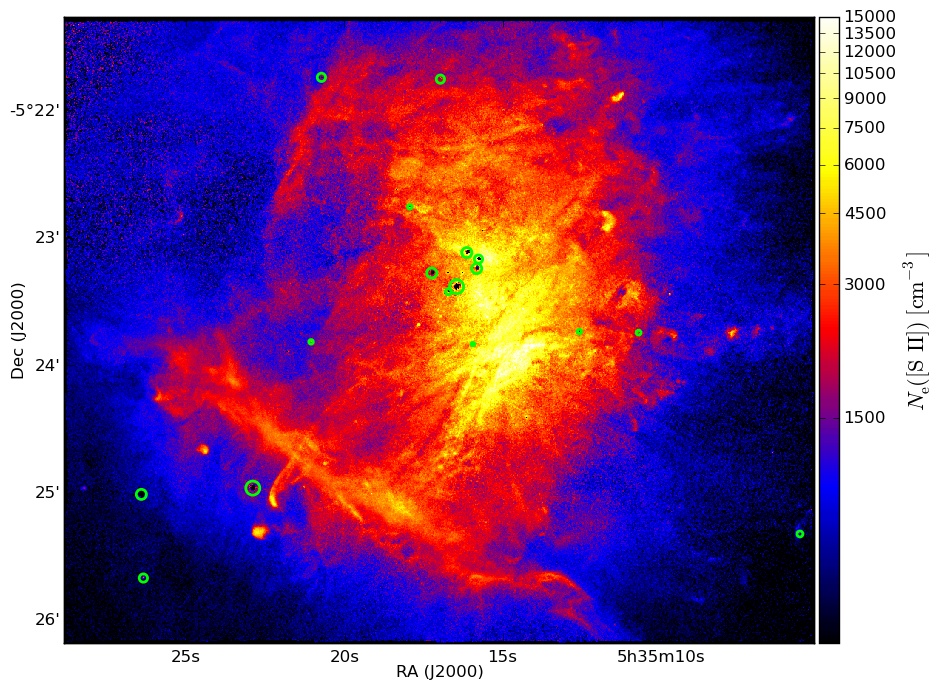 Electron density (n_e) of M42 computed from [S II] Link to FITS files: n_e map unsmoothed and smoothed (with 3x3 pixel median filter)
Spatial velocity field
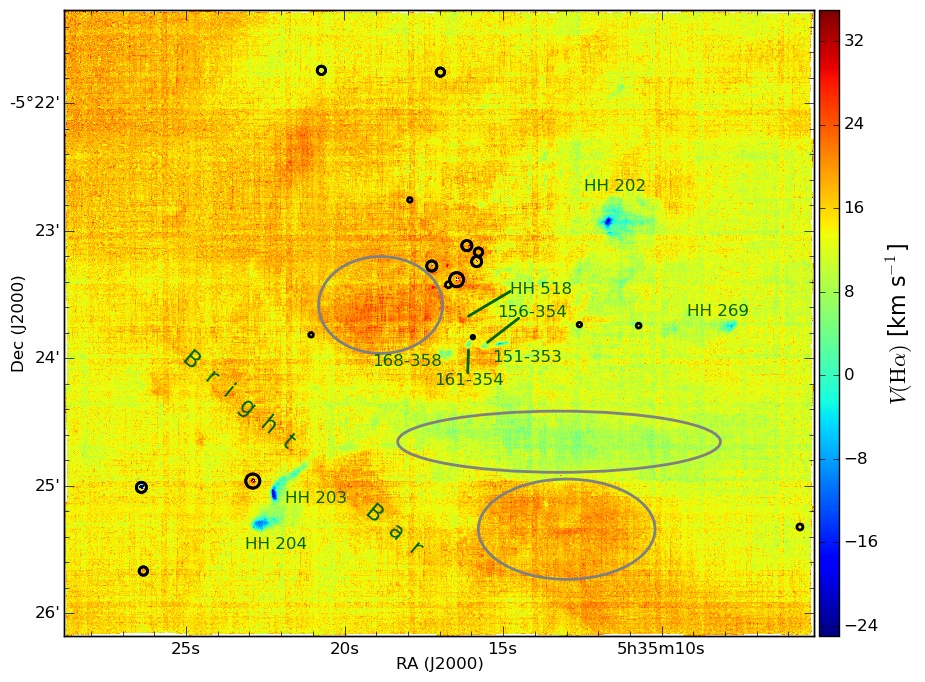 Velocity field as traced by the lines Hα (with respect to barycentric velocity). The locations of the brighter stars in the field are marked as black circles, further noticeable features are annotated or marked in green or gray. Link to FITS file: Hα velocities
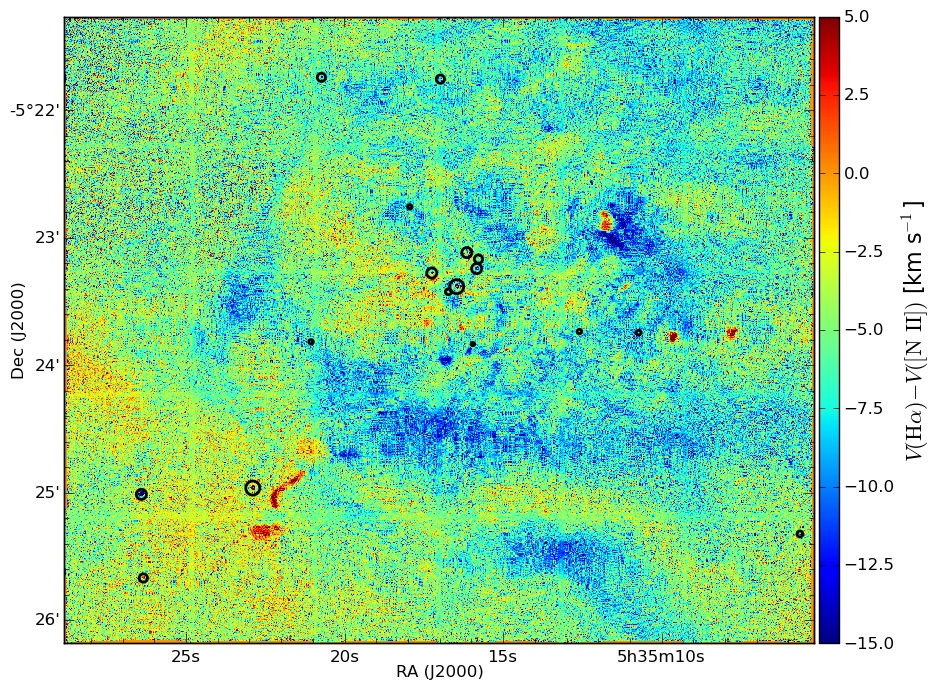 Velocity field as traced by [N II] 6584 relative to Hα. Note that the linear color scale is asymmetric. The locations of the brighter stars in the field are marked as black circles. Link to FITS files:
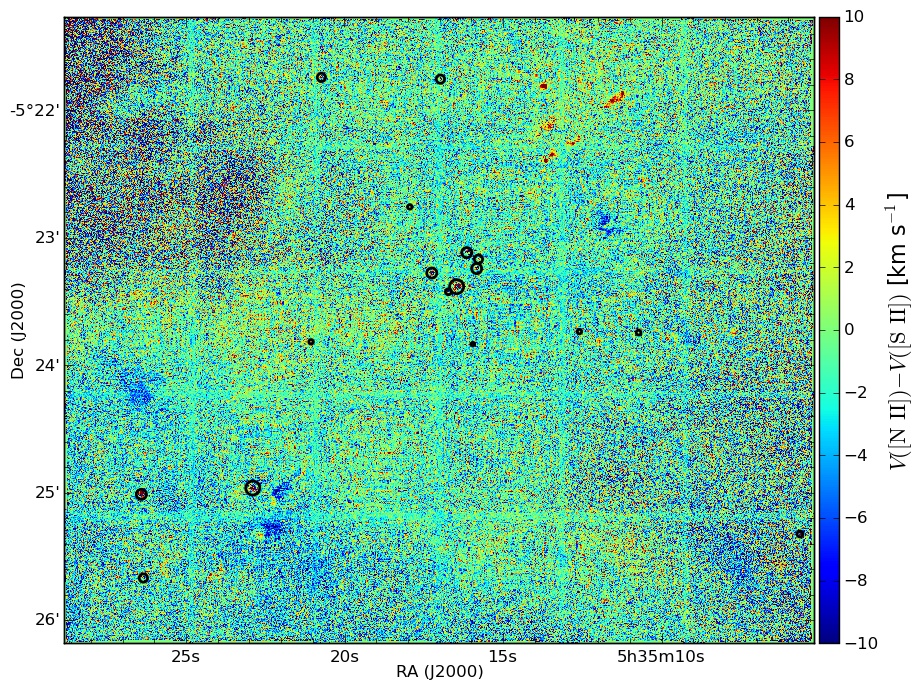 Velocity field as traced by [S Ii] 6731 relative to [N Ii] 6584. The locations of the brighter stars in the field are marked as black circles. Link to FITS files:
All M42 Data
We also offer all above FITS maps of M42 combined in one ZIP file (577 MiB).
Antennae Galaxy (NGC 4038/39)
Release of data of the two fields in the Antennae Galaxy (NGC 4038/39, Arp 244), published by Weilbacher et al. 2018 (2018A&A...611A..95W or arXiv:1712.04450).
Maps
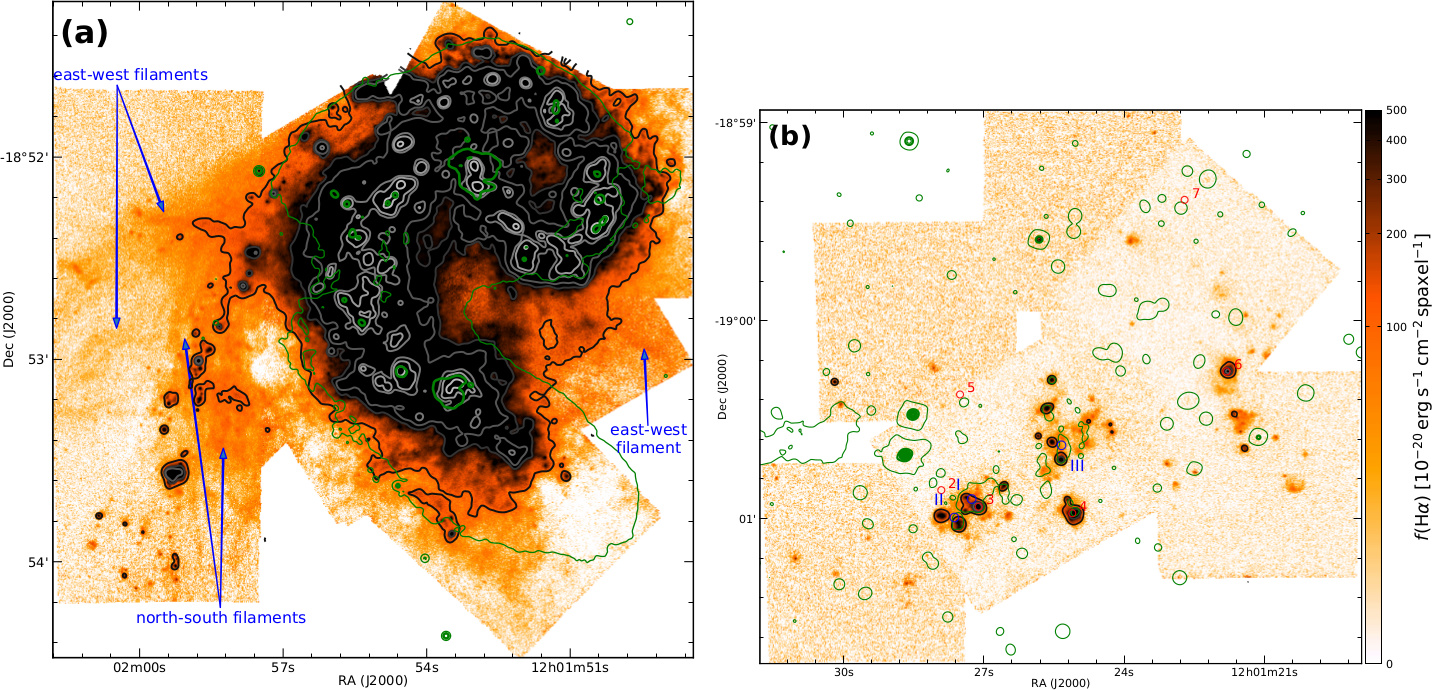 Continuum-subtracted Hα flux maps for (a) the central and (b) the southern region, as produced by the narrow-band technique. FITS files: Antennae Center and Antennae South
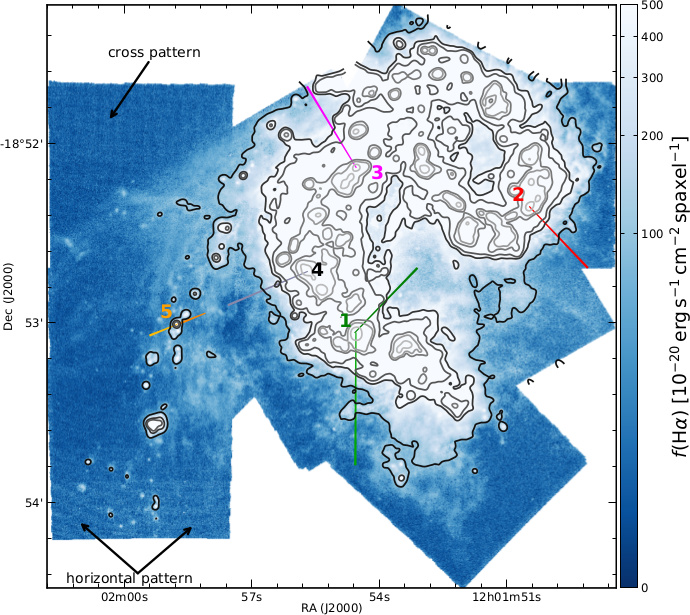 Hα flux map from Gaussian line fits to the emission line, of the central field only. FITS files: Antennae Center and Antennae South
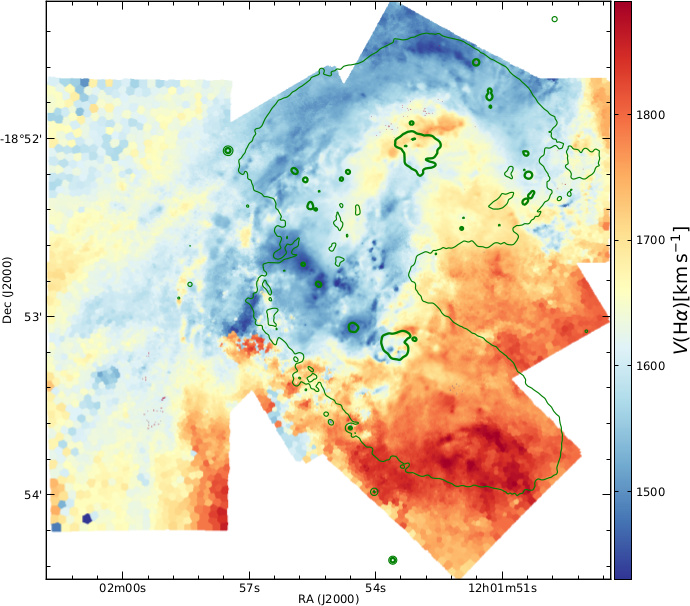 Velocity derived from the Hα emission line in the central field of the Antennae. FITS file: Antennae Center only
Tables
HII region properties
- measurements in central field: FITS binary table and VOTable file
- measurements in southern field: FITS binary table
All Antennae Data
We also offer all above downloads combined in one ZIP file (28 MiB).
Tools
A number of software tools were developed in the MUSE collaboration that are linked here.
LSDCat – Line Source Detection and Cataloguing Tool
LSDCat is a conceptually simple but robust and efficient detection package for emission lines in wide-field IFS datacubes. The detection utilises a 3D matched-filtering approach for compact single emission line objects. Furthermore, the software measures fluxes and extents of detected lines. LSDCat is implemented in Python, with a focus on fast processing of the large data-volumes of typical wide-field IFS datacubes.
The code and documentation can be found here:
MPDAF – the MUSE Python Data Analysis Framework
MPDAF is an open-source (BSD licensed) Python package, dedicated to the analysis of MUSE data. It has been developed and used in the MUSE Consortium for several years, and is now available freely for the community.
It provides tools to work with MUSE-specific data (raw data, pixel tables, etc.), and with more general data like spectra, images and data cubes. Although its main use is to work with MUSE data, it is also possible to use it other data, for example HST images. MPDAF also provides MUSELET, a SExtractor-based tool to detect emission lines in a datacube, and a format to gather all the information on a source in one FITS file.
- Documentation
- astro-ph: “MPDAF – A Python package for the analysis of VLT/MUSE data“, Piqueras et al. 2017, Proceedings of ADASS XXVI
- GitLab at CRAL: Source, issues and pull requests
- Releases on PyPI
- Mailing list to get help or discuss issues
ZAP – the Zurich Atmosphere Purge
ZAP is a high precision sky subtraction tool which can be used as complete sky subtraction solution, or as an enhancement to previously sky-subtracted MUSE data. The method uses PCA to isolate the residual sky subtraction features and remove them from the observed datacube. ZAP 2.0 (released 2017-09-08) is compatible with the WFM-AO mode, and also brings major improvements for the sky subtraction. See the details in the Changelog. The code can be found at GitHub
The paper can be found at arXiv and MNRAS (Soto et al. 2016, MNRAS, 458, 3210).